VSCode CubeMX Project Setup
Table of Contents
Up until now, i’ve used STM32CubeIDE with STM32CubeMX as my primary development tools for STM32 microcontrollers. CubeIDE has lots of useful features available out-of-the-box. However, it also suffers from pretty feelable bloat, caused by the fact that it’s heavily modified Eclipse IDE with lots of plugins that pile up pretty quickly. It also lacks some features that i’m used to having in more… “civilized” IDE’s (dark theme which is not hurting the eyes with contrast by default? better Git integration? and probably lots of other, smaller thingies). So, i’ve decided to try something new and the first obvious choice was Visual Studio Code.
The second choice would be CLion, which has pretty decent CubeMX project support out-of-the-box, but it is sometimes a little bit buggy with debugging the projects… or at least it was few months ago, when i tried it. Maybe it got fixed.
So, after few hours of tinkering and lurking around for guides and plugins, i’ve found my setup. Most of the config i’ve taken from two great videos by Embedded Geek (first one is here, second one - here), but i’ve changed some things since i’m not using the exact same VSCode config as he does (which, actually, makes things easier and less painful to configure for me). I also made sure that it should work on both Windows and Linux (and probably MacOS).
If you are very lazy, you can use
stm32-for-vscodeplugin instead of this guide. It should do most of the work described there automatically. However, it uses default IntelliSense engine, and as i prefer clangd and knowing how to configure the project from scratch (so when something goes wrong, i know how to fix it), i still created this guide. I’ve used it in the past, but after trying it again and comparing with setup made using this guide i found out it doesn’t offer better experience in the long run
Anyway, let’s get to it.
Prerequisites⌗
From hardware side, you need to have an STM32 board, and a debugger that’s compatible with it. For this guide, i’m using Nucleo-G474RE, with STM32G474RET6 microcontroller, and STLink v3 onboard. The exact choice of MCU and debugger doesn’t matter, as this setup will work with any STM32 MCU and every debugger supported by OpenOCD. Also, you’ll need an USB cable to connect the board to your PC. If you’re using ST-Link, update it’s firmware before proceeding. You can do it with this official tool. Free ST account is required to download it.
From software side, these tools are required:
- STM32CubeMX - STM32 MCU helper and code generator, simplifies the project generation and MCU initialization to maximum - downloadable for free from official ST site here. Requires free ST account to download. PSA for HAL-haters: you don’t have to use HAL even if you generate the code using CubeMX - read about LL libraries, you can use them too, and they are as close to the metal as it’s sanely possible. I’ll put a quick info about it at the end of this guide, as a bonus.
- ARM-GCC toolchain (
arm-none-eabi-gccto be specific, along with all the other GCC tools, and GDB). Linux users should have latest version in the repositories - make sure you also installarm-none-eabi-newlibandarm-none-eabi-binutilsif these are separate packages. Windows users can either use their preferred package manager, or download the latest toolchain manually from official ARM site - MacOS and Linux versions are available there too, in case you don’t have one in repositories. Just make sure it’s in your OS PATH variable before proceeding - open terminal and try runningarm-none-eabi-gcc --version. If it fails, add the toolchain’sbindirectory to PATH. - OpenOCD - we’ll use it to debug and flash the firmware on our microcontroller. Get it from your package manager, or via one of the unofficial distributions listed here. Or you can also build it from source, which is fairly easy. Make sure it’s in PATH too - check if
openocd --versionprints the info, if not - add the directory with it’s executable to PATH. - Visual Studio Code - obviously. If you are new to this editor, i strongly suggest to check out my previous guide about configuring it for C/C++ projects with CMake. We won’t use CMake here (although it is possible to do that with a little bit of help from
stm32-cmakerepository), but i will useclangd, as i prefer this language server over the default one, and it’s easier to set-up. So, if you want to stay with default language server, keep in mind that you will have to configure include paths manually, which is painful and i won’t describe it here. If you have no idea what i’m writing about here - just follow this guide and install all the plugins listed below. I strongly recommend to use these plugins for VSCode:- C/C++ - for general C and C++ language support - required;
- Cortex-Debug - for ARM Cortex-M debugging - required;
- clangd - alternative language server that usually works better than default one, and has easier and more robust config. Also features configurable code auto-formatting. If you don’t know what language server does, or you haven’t played with default one yet - install and use
clangd, you can find basic setup instructions here, and i’ll guide you through configuration for this project. If you know what you’re doing - have fun. - ARM - for ARM assembly language support. Useful when lurking around *.s files - optional;
- LinkerScript - for linker script language support. Useful when lurking around *.ld files - optional;
- And also plugins from my list of recommended C/C++ plugins, which you can find here.
- ST-Link (or your preferred debugger) drivers - if you already have STM32CubeIDE or STM32CubeProgrammer installed on your system, you should already have them. If that’s not the case, then either install STM32CubeProgrammer to get all the drivers that you’d need for most STM32-compatible debuggers, or download and install the drivers for your specific debugger and OS manually. Just make sure that your debugger is detected correctly by your operating system before proceeding.
And that should be just about it. If you have everything set-up, can get to work on our project.
Creating a project⌗
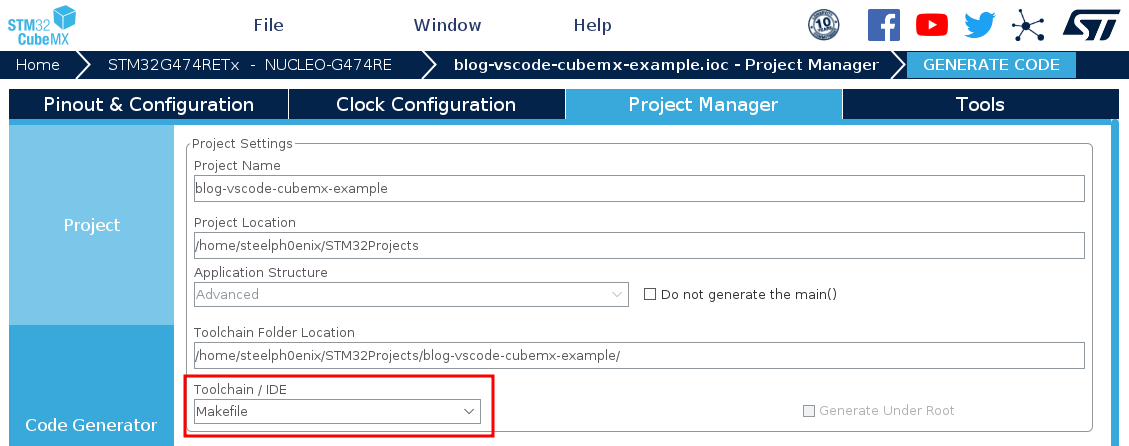
Open up STM32CubeMX and make a new project. I’ll assume that you already have basic knowledge of STM32CubeMX usage, so you can create a project for your board. After that, set up your peripherals (i’ll just use onboard LED which is set up by default to test stuff out), make sure the debug is enabled (System Core -> SYS -> Debug), clocks are configured correctly (Clock Configuration tab on the top of the window), and go to Project Manager tab. Fill up the project name and location, and set Toolchain/IDE to Makefile. Save the project after that.
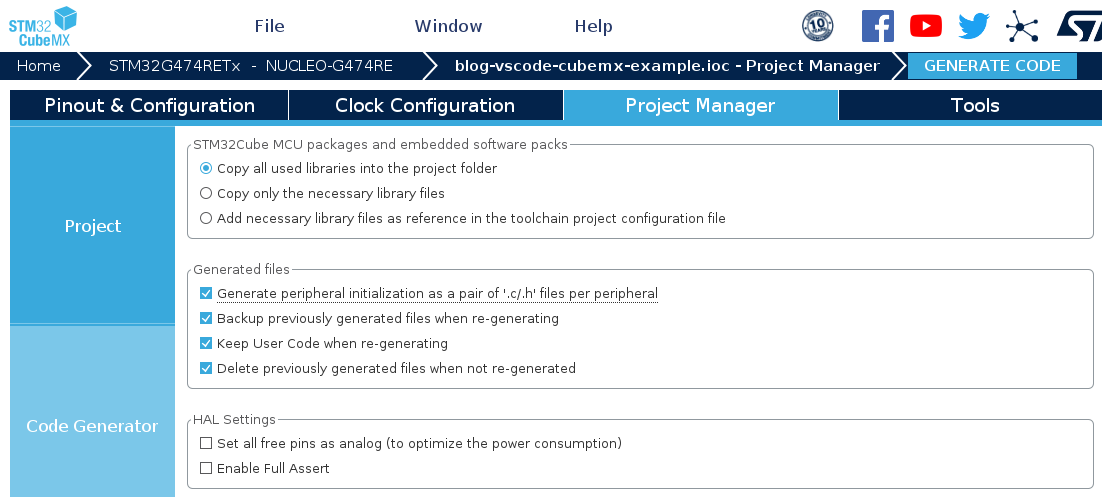
Next, i recommend going to Code Generator tab on the left and selecting all the checkboxes in Generated files section. I do it as force of habit, to have a bit better organized project.
When you’re done with CubeMX config, Generate the code and open the directory with the project in Visual Studio Code.
Setting up the project in VSCode⌗
Building the project⌗
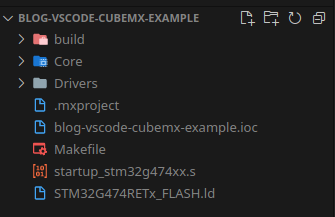
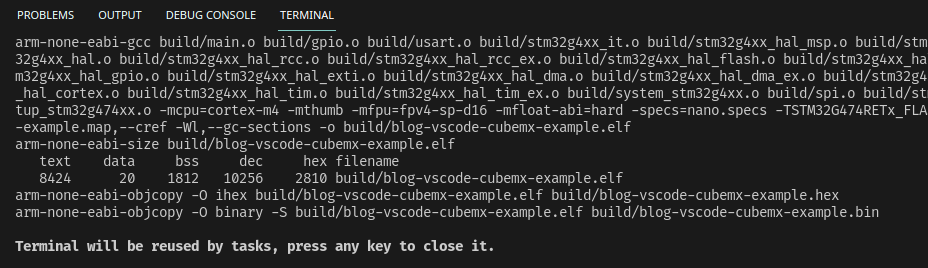
Now, time for the fun part. First, we’ll make sure we can build the project. Open integrated terminal (Ctrl+` to open existing one, or Ctrl+Shift+` to create a new one) and run make. You should see some output - the commands ran by Make, and size of output binary - and a new directory called build should appear. The project directory should look like this now:
If the build failed, read the error message, check if you have all required prerequisites, and look around the internet for support - most of basic issues have been solved by someone already, and solutions are out there.
The build directory should contain a lot of object (*.o) , listing (*.lst), and *.d files, along with few binaries with the same name as your project, and also a *.map file, which contains the memory map of whole program.
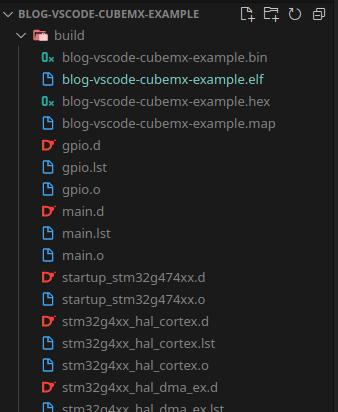
The only file here that’s currently interesting for us is the *.elf file - this is the actual compiled binary we’ll flash to MCU using OpenOCD. *.bin and *.hex files are compiled binary files too, created out of the *.elf file, but they are usually used in different scenarios (for example, *.bin file can easily be used by custom bootloaders, as it’s basically raw compiled code, stripped out of unnecessary stuff).
Configuring the language server (clangd)⌗
If you’re able to build project successfully, then it’s time to set up our language server. Clangd requires compile_commands.json file to work properly - this file contains translated output from your build system, that tells Clangd how the project is built. Thanks to that, Clangd can automatically detect the configuration you’re using and you doesn’t have to manually set anything up, unlike in default language server, where you’d have to set the include directories, flags and toolchain manually in JSON file.
There are few ways to generate compile_commands.json. As i’ve described in my previous blog post, CMake generates this file automatically. However, we are not using CMake, so we have to use external tool for that. I’ve know of two, that i managed to get working without issues: Bear, which supposedly works only on Linux, but apparently there is a version available in winget repository, and compiledb which should work anywhere, and is written in Python, so you need it installed to use it. Note: install compiledb IN USER DIRECTORY (python3 -m pip install --user compiledb), because it may not work when installed globally due to permission issues! If you encounter permission-related issues, make sure all of it’s dependencies are installed in user directories too! And make sure it’s in your PATH variable! Same goes for Bear.
The usage of these tools is simple: you run them with your build command, so they take it’s output and convert it to Clangd’s compile_commands.json. In case of Bear, you also have to make clean-build (run make clean before running it), which makes it troublesome to integrate with our setup, so i’m going to use compiledb here.
To build the project and generate the compile_commands.json, run compiledb make -j8.
Tip: You can tell
maketo build using multiple threads with-jargument. This will significantly decrease compilation time. For example:make -j8will build the program using 8 threads. Modify this argument according to your CPU capabilities (amount of cores and thread per core).
Compiledb will run make and pass all the arguments to it, -j8 in our case. After running this command from the project root, the compile_commands.json should appear there. Open any *.c or *.h file, or re-open, if you opened them already, and check if the language server works - you should now see no errors related to missing includes or unrecognized function, see the tooltips for code on hover, and have all the other language-server-related features working.
Configuring standard library visibility⌗
After playing with clangd a bit more in this project, i found out that even though project builds successfully when i use standard library, clangd doesn’t recognize it’s headers for some reason. I suppose it’s because the target platform is not the native one, so it doesn’t know where to look for headers. I’ve fixed it by adding include path with stdlib headers to C_INCLUDES variable in Makefile, and clean-building the project.
# C includes
C_INCLUDES =  \
-ICore/Inc \
-IDrivers/STM32G4xx_HAL_Driver/Inc \
-IDrivers/STM32G4xx_HAL_Driver/Inc/Legacy \
-IDrivers/CMSIS/Device/ST/STM32G4xx/Include \
-IDrivers/CMSIS/Include \
-I/usr/arm-none-eabi/include
Flashing the binary⌗
We’ll create a rule in Makefile to flash our program to MCU. You could do this as VSCode task too, if you’d like, with slight modifications.
Open the Makefile, and somewhere on the bottom, before EOF marker, add a new rule that will run OpenOCD:
flash: all
    openocd -f interface/stlink.cfg -f target/stm32g4x.cfg -c "program $(BUILD_DIR)/$(TARGET).elf verify reset exit"
If you are not using ST-Link, change the interface config file to proper one. Same applies to MCU config file - switch it to one that’s for MCU you’re working on. All the configuration files are stored in OpenOCD installation directory. If you’re on Linux, they should be stored in /usr/share/openocd/ by default.
The rest of this command tells OpenOCD what to do - program the specific ELF file to MCU flash memory, verify the memory integrity, reset the MCU and exit.
It also requires all rule, so the project will build itself automatically and upload the ELF file to MCU every time you run make flash now. This does NOT dissapear during CubeMX project re-generation, so you don’t have to worry about copy&pasting it every time you do this.
To delete all the build files (to do a clean build for example), use make clean command.
Configuring VSCode tasks⌗
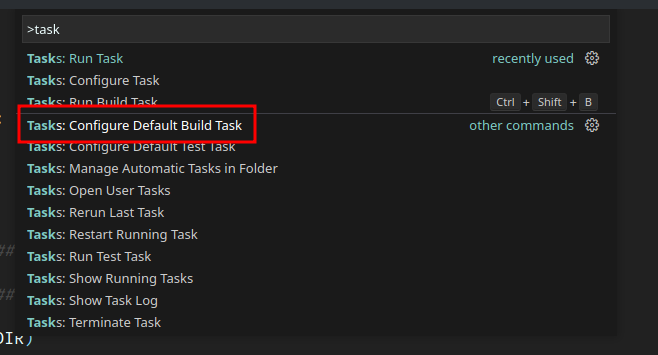
To get some degree of automation, we’ll create VSCode tasks for building, cleaning and flashing the project. Open command prompt in VSCode (Ctrl+Shift+P), and look for Tasks: Configure Default Build Task command (or Task: Configure Task).
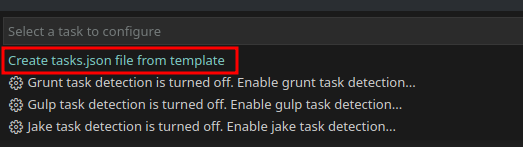
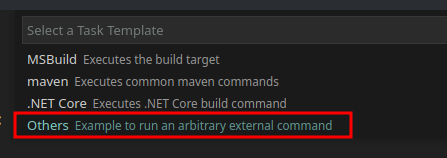
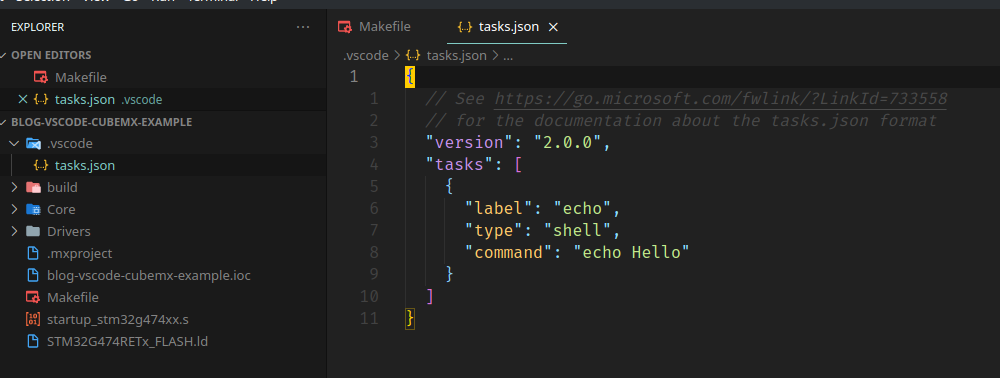
Then, select Create tasks.json file from template, and select Others template.
After that, you should see this tasks.json file, which happened to be added to .vscode directory in project root. If you’re using VCS (Git or Mercurial for example), you should be able to store it in repository without any issues, so don’t wildcard out the entire .vscode directory in your .gitignore (or any other VCS-related ignorefile) to keep the tasks.
Copy this task and modify label and command accordingly, to create a build, clean and flash task. After that, run Tasks: Configure Default Build Task command again, and select your build task. Remember that we’re using Bear/compiledb to generate compilation database for Clangd! Don’t call make for building the project directly, to always have updated and correct database! Now, your tasks.json file should look similar to this (change the thread amount accordingly to your CPU capabilities):
{
  // See https://go.microsoft.com/fwlink/?LinkId=733558
  // for the documentation about the tasks.json format
  "version": "2.0.0",
  "tasks": [
    {
      "label": "Build",
      "type": "shell",
      "command": "compiledb",
      "args": [
        "make",
        "-j8"
      ],
      "problemMatcher": [],
      "group": {
        "kind": "build",
        "isDefault": true
      }
    },
    {
      "label": "Build & Flash",
      "type": "shell",
      "command": "compiledb",
      "args": [
        "make",
        "flash",
        "-j8"
      ]
    },
    {
      "label": "Clean",
      "type": "shell",
      "command": "make",
      "args": [
        "clean"
      ]
    }
  ]
}
Test the tasks out by running Clean task (Tasks: Run Task command -> select Clean task -> don’t scan the output, if you’re asked for that), and using Tasks: Run Build Task shortcut - Ctrl+Shift+B. The program should first clean, then build itself, and you should see make output in integrated console window.
Make a backup of this tasks.json file, because it should be exactly the same for every project configured this way.
Also, reminder: instead of putting openocd call in Makefile, you can do it directly in VSCode task if you want - just split the arguments correctly (the command after -c should be a single argument), and set the Build task as Flash task dependency with dependsOn list option. You can also create a flash-only task like that. It’s up to your preference.
Configuring the debugger⌗
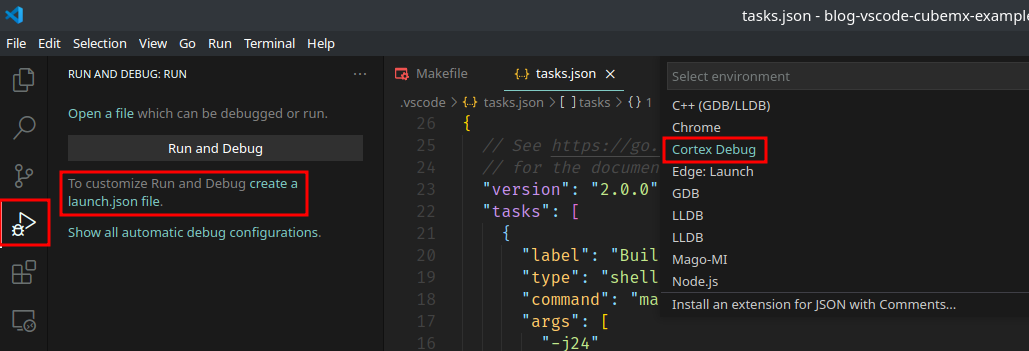
Time to configure the debugging task. Go to the debug tab, and click on create a launch.json file. Then, from the list, select Cortex Debug option.
You should now have this file created, with default task for Cortex Debug plugin. We’ll have to change few things to make it working with OpenOCD, our debugger and MCU.
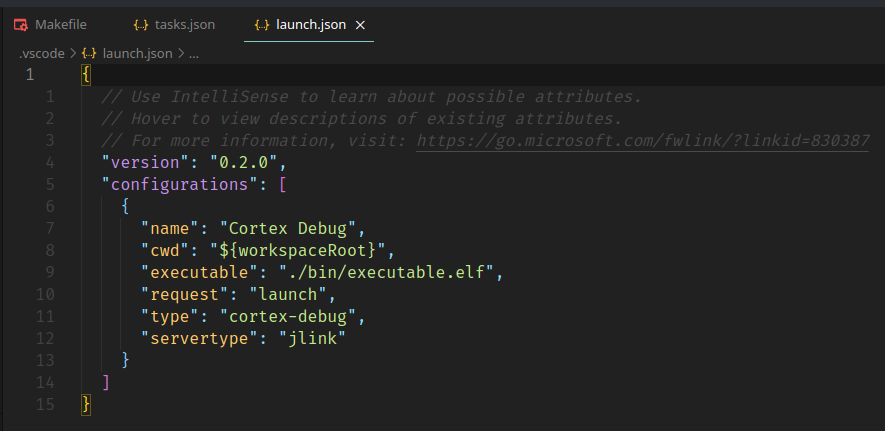
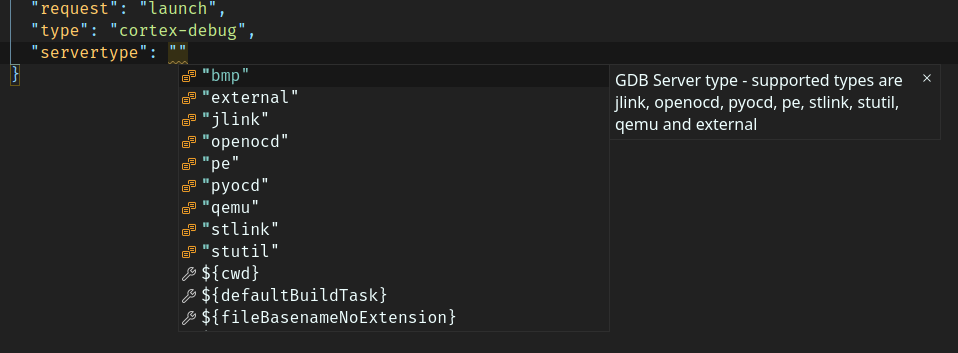
First, we’ll have to change the path to executable, so it points to the elf file with our program, which is in ${workspaceRoot}/build/ directory. Then, we have to change servertype to openocd. It’s not the only debugger that Cortex Debug can use, you can see the whole list by calling autocompletion in empty field. Most of them should work with STM32, but i’ll focus on OpenOCD.
Then, we have to configure some OpenOCD-related stuff. We have to specify device, and put the microcontroller name in it (without Tx suffix, which corresponds to the temperature version of chip: for example, i’m using STM32G474RET6, but in device i have to put only STM32G474RE, because all the temperature versions have exactly the same silicon inside). We also have to specify the configuration files for OpenOCD - the same ones that we specified for flashing. You can do it via configFiles list.
You should also specify preLaunchTask, so VSCode will always build and flash the binary before starting debug session. It’s important, because if you’d forget about it and start debugging session with different program on MCU than on your PC, debugger - at some point - will start showing you complete junk and unreasonable code flow, and if you are not aware of that, you will probably spend a lot of time thinking what’s wrong with your code or MCU.
The launch.json file content should now look like this, except the device and target config files should conform to MCU and debugger you’re using, preLaunchTask should have the same name as your flash task, and executable should point to your ELF file.
{
  // Use IntelliSense to learn about possible attributes.
  // Hover to view descriptions of existing attributes.
  // For more information, visit: https://go.microsoft.com/fwlink/?linkid=830387
  "version": "0.2.0",
  "configurations": [
    {
      "name": "Cortex Debug",
      "cwd": "${workspaceRoot}",
      "executable": "${workspaceRoot}/build/blog-vscode-cubemx-example.elf",
      "request": "launch",
      "type": "cortex-debug",
      "servertype": "openocd",
      "device": "STM32G474RE",
      "configFiles": [
        "interface/stlink.cfg",
        "target/stm32g4x.cfg"
      ],
      "preLaunchTask": "Build & Flash",
    }
  ]
}
If everything has been configured correctly, you should be able to debug your program now. Add a breakpoint in the first line of main function (click left to line number, red dot should appear) and run the debugging session (F5 by default, or click a button on top of Debug menu).
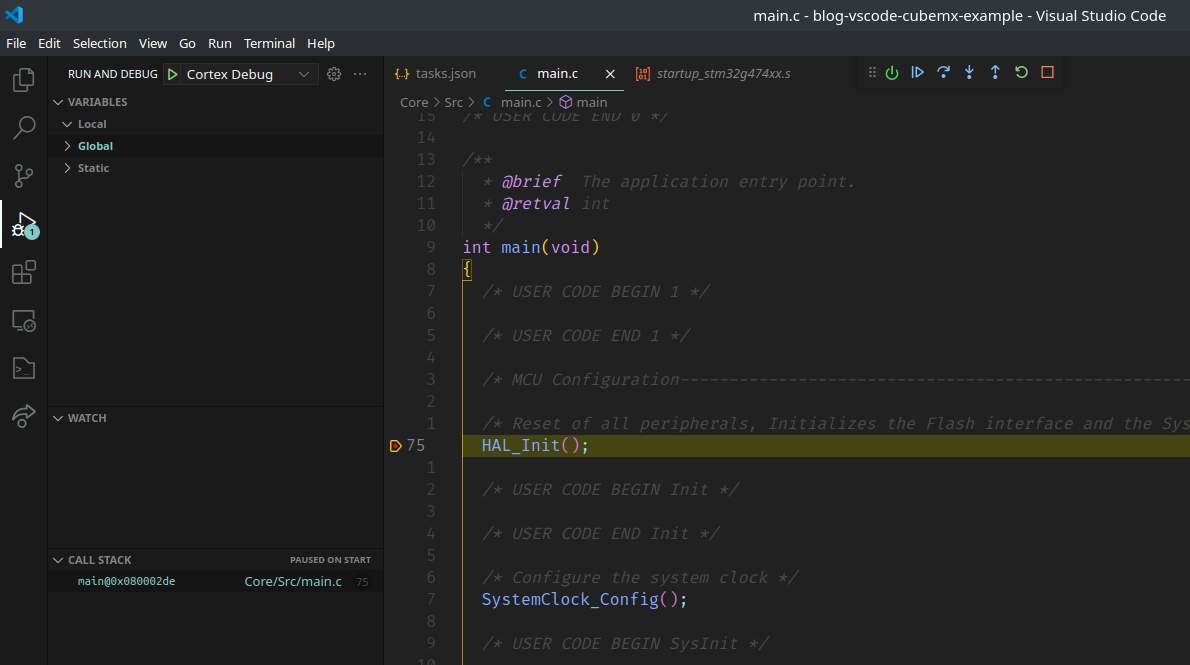
VSCode should switch to debug perspective, and you should be able to see variables/objects (expand Global section), call stack, and add variables/objects to the watch. You should also be able to step through the program - either via controls on top, or keyboard shortcuts (F5 to let the program run until the next breakpoint, F10 to step over current line, F11 to step into current line, Shift+F11 to step out of current scope, Ctrl+Shift+F5 to restart debugging session, and Shift+F5 to stop debugging session). There’s also a button to reset the MCU (first from left).
Configuring the peripheral view⌗
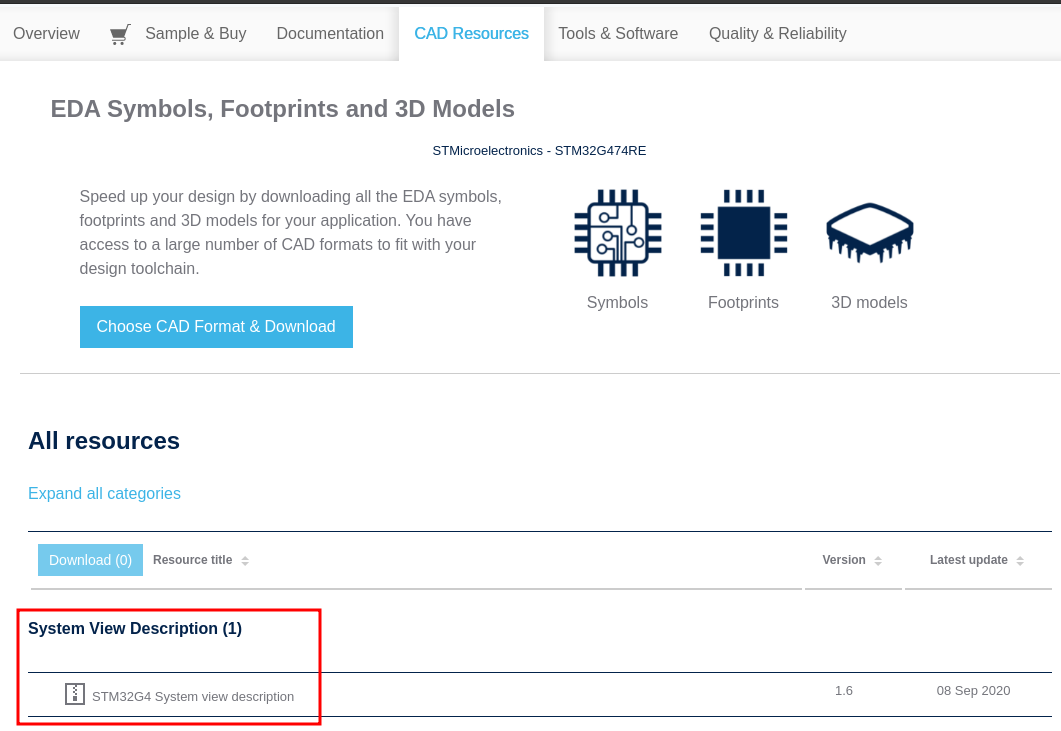
Finally, to see all the peripherals of our MCU and their registers content, we can download and specify SVD (or rather, to be precise, CMSIS-SVD - System View Description) file. This step is optional, but being able to see the peripherals is useful, so i recommend doing this anyway. For ST MCU’s, you can get SVD files from the MCU page on st.com. For example, in case of my MCU i go here, into CAD Resources tab, and i download STM32G4 System view description (ST account not required).
After that, i unpack it. Inside unpacked archive, there should be a directory wih *.svd files - find one compatible with your MCU (in my case it’s named STM32G474xx.svd) and copy it to project root directory. Now, open launch.json and add new option in debug configuration:
"svdFile": "${workspaceRoot}/STM32G474xx.svd",
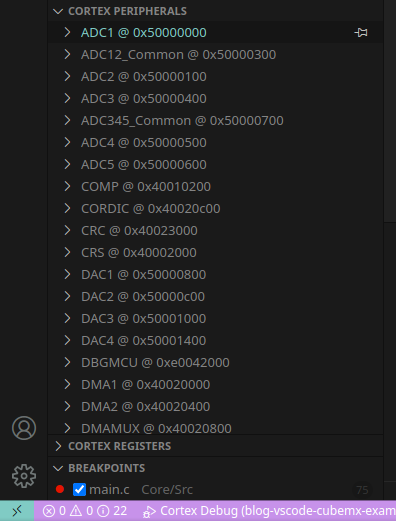
Of course, change the name of the file to correct one. To check if it’s working, start debug session (F5) and look for Cortex Peripherals section in debug view. Open it and check if you can see the peripherals, along with their addresses, registers and register fields content.
And that’s all. If you did all the steps, and verified they’re working, congratulations - you now have an alternative for CubeIDE for STM32 development with CubeMX, that isn’t very painful to configure and has most of the features you’ll need. I’ve heard that Cortex Debug also allows to configure ITM output, but i haven’t tried that yet, so i’ll probably describe it in different blog post in the future.
Now, for the bonus part…
STM32 HAL vs LL libraries, and how to change between them in CubeMX⌗
If you’re using CubeMX for STM32 projects, you are (most probably) inherently using HAL libraries to work with the MCU. HAL is an Hardware Abstraction Layer - set of libraries which abstract operations on the hardware, that are easy to use for someone who doesn’t want to dig through the manual to do even simplest things. Also worth mentioning, that STM32 HAL is mostly the same under all STM32 MCUs, therefore moving project that relies on HAL between different STM32 MCUs in the same family, or even between different families of STM32 MCUs, is fairly easy. However, it do have some issues - mainly, the memory bloat that’s sometimes really noticable (especially on low-end MCUs with very little memory - some of them even can’t use HAL at all, because it takes more memory than they have for simple project with just the initialization code). It can also be slower than dedicated solutions, due to handling almost everything that can happen every time.
The solution of these issues doesn’t have to be throwing away CubeMX, and going back to the registers and CMSIS level, writing everything manually. There is an alternative - Low Layer libraries. These exist for all the peripherals that don’t require upper-level stack (like USB or Ethernet), and are significantly lighter than HAL. However, they are also more complicated to use, as they don’t cover the functionality as HAL libraries do. LL offers a low-level API that’s just above the registers. In other words, LL is an almost unnoticeable (performance and memory-wise) layer that abstracts the registers away, giving you fairly well documented and more readable API instead, that doesn’t take away much control from you.
To learn about HAL and LL differences in detail, i suggest going to CubeMX package site for your STM32 MCU (in my case: this one), into Documentation section, and reading User Manual called Description of STM32XY HAL and low-layer drivers, where XY symbolize you series. You can find full documentation of both HAL and LL libraries there, along with their philosophy.
There is an easy way of changing between HAL and LL drivers in CubeMX: open the project and go to Project Manager -> Advanced Settings.
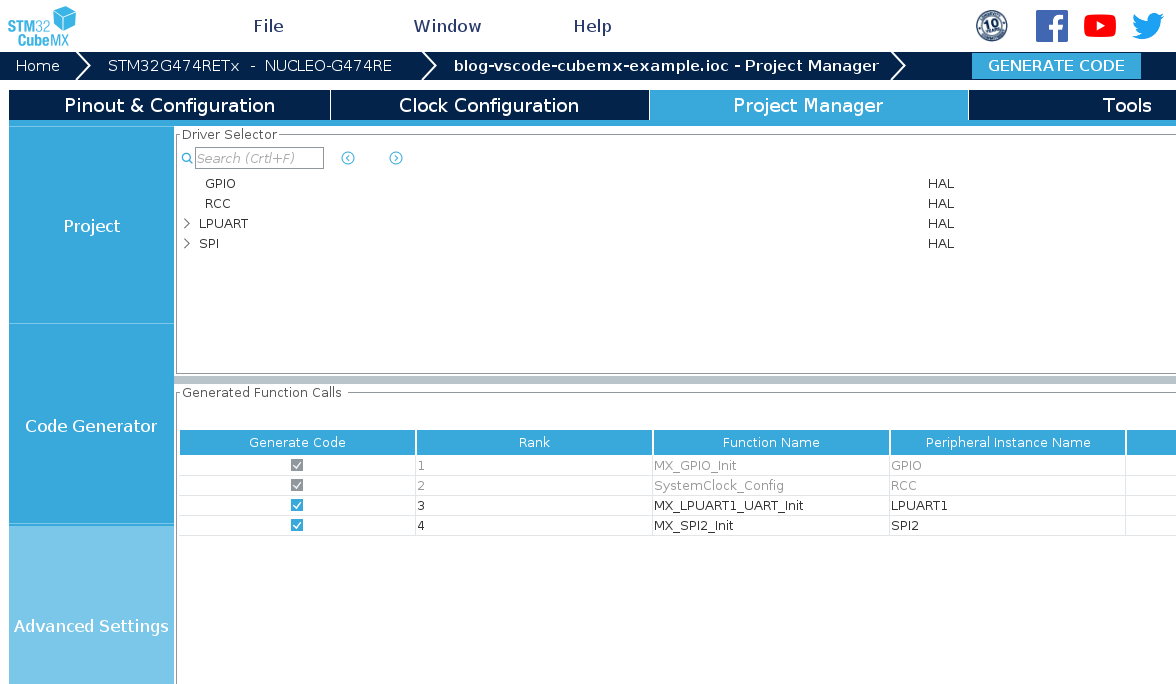
You can do three things there:
- Change between HAL and LL drivers for every peripheral, and even every instance of peripheral;
- Configure the initialization order of used peripherals (very useful for issues with DMA, when it’s wrongly initialized after the peripheral that’s using it);
- Enable or disable callback registration per peripheral (as an alternative to global interrupt callbacks).
While you still might not want to use LL, it’s a good idea to take a look there if you look for memory to free. For example, if you are not using any peripheral-related functions in code, yet you need that peripheral initialized (which can be a case for RCC for example), you can switch it from HAL to LL to save few bytes of memory without touching the code yourself. But remember: HAL and LL functions ARE NOT inter-compatible. You CANNOT use both HAL and LL for the same peripheral at the same time (without proper precautions), as HAL requires a handle that’s state reflects the current state of peripheral. If you start using non-HAL code along with HAL, you HAVE TO make sure the state in HAL handle will not be invalid when HAL functions are being called (in interrupts that use HAL handlers too!), otherwise HAL code can break the program.
Summary⌗
And that would be it. Thank you for reading, and if you have questions or issues, feel free to contact me or drop an issue/pull request in the blog’s repository.